TL;DR
Twelve buildings, 480,000 sq ft, and 18 acres of campus captured in 9 field days on one coordinate frame — 47 permanent control points held ±0.02 ft (±6 mm) campus-wide. Facilities got a federated model that flagged 19 non-compliant curb ramps, avoided 6 exploratory digs, and saved about $85,000 in repeat field verification.
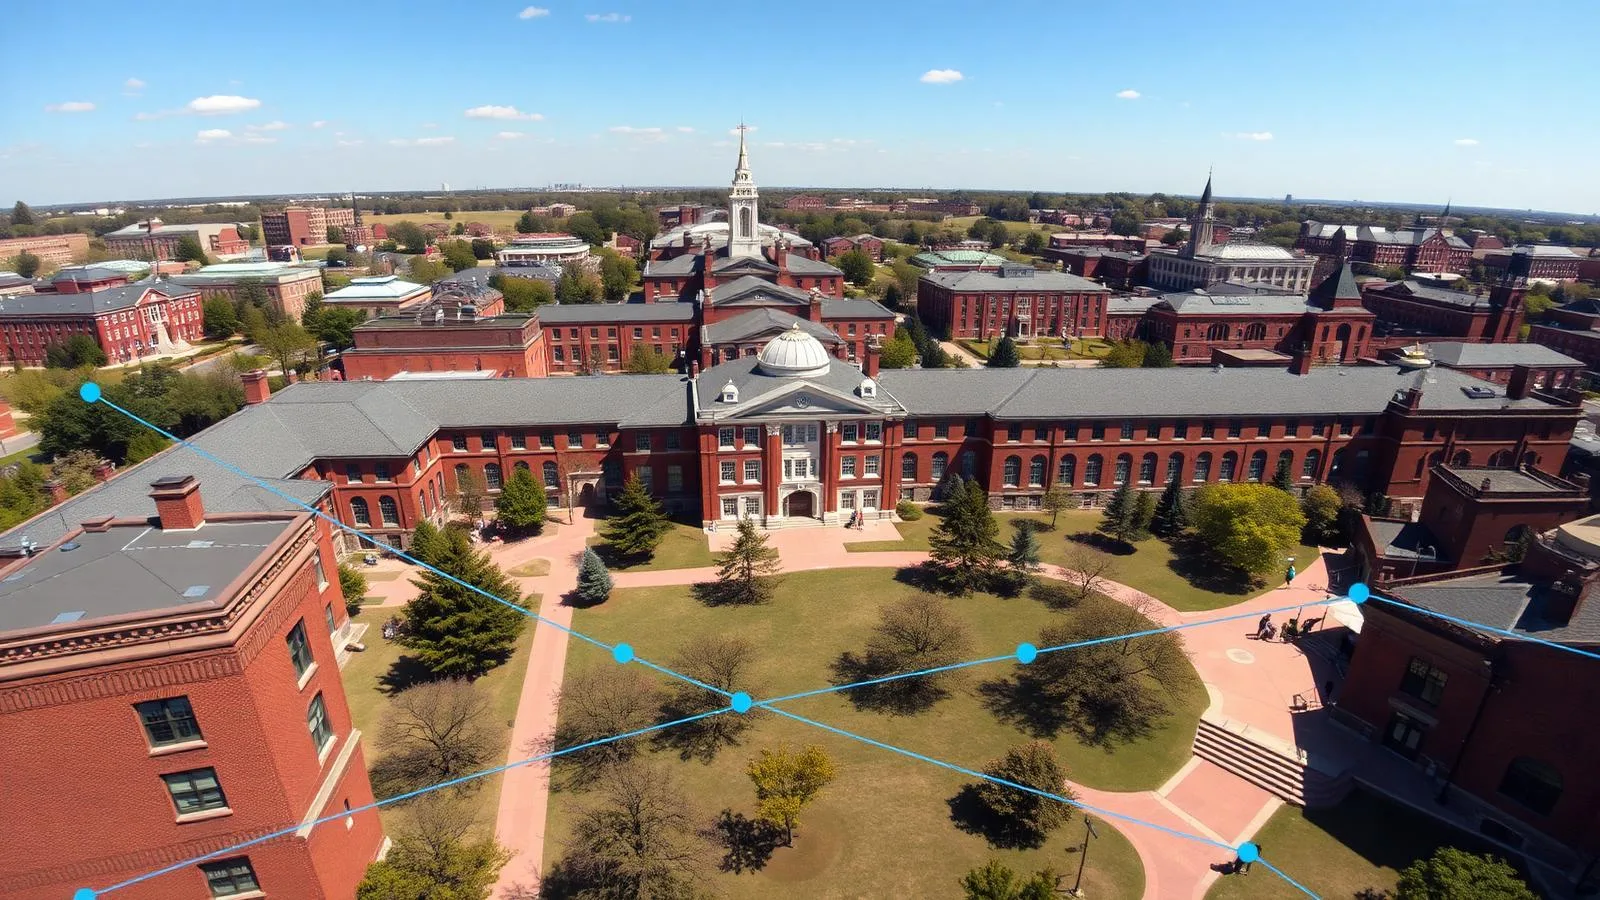
A regional Ohio university asked for something their facilities group had wanted for years: one coordinated, measured digital view of the entire campus — not just buildings, but the lawns, paths, and utility corridors that tie it all together. Twelve academic buildings. 480,000 sq ft of interior space. Eighteen acres of exterior context. Nine calendar days on site.
We kicked off on a cold Tuesday before sunrise. The campus library opened at 7:00 a.m., so we walked it at 4:30 with the NavVis VLX3 while custodial crews finished up. By 8:15 the corridors were full of students again and we’d already closed our first SLAM loop in the humanities building.
Scope at a Glance
- 12 academic buildings (1890s brick halls through a 2014 science center)
- 480,000 sq ft interiors across 4 floors average (lowest crawlspace at 4 ft, tallest rotunda at 66 ft)
- 18 acres exterior context: quads, walks, parking, mature tree canopy, athletic walkways
- Unified control in Ohio State Plane North, NAD83(2011), US Foot — every scan, every model, one coordinate frame
This wasn’t “scan a building.” It was a campus-wide reality capture effort set up to support the master plan, future renovations, and day-to-day facilities work. If your team is planning a similar effort, our process below mirrors the way we deliver Building 3D Laser Scanning and As-Built Documentation on complex, multi-structure sites.
Step 1: Campus-Wide Control That Doesn’t Drift
Treating each building as its own island is the fastest way to create rework. A new walkway misses a door threshold by 0.5 ft. A chilled-water tie-in lands under a planter. We see it too often.
We started with a GPS-tied control network stitched across the entire site:
- 47 permanent control points installed (stainless survey nails and wall targets), distributed roughly every 150–200 ft through the quads and at primary building entries
- GNSS observations tied to the Ohio CORS network (two 30-minute sessions per mark, PDOP < 2.0), then constrained to Ohio State Plane North
- Robotic total station traverse through tree cover; traverse closure 1:25,000 with residuals ≤ 0.008 ft (≈2.4 mm)
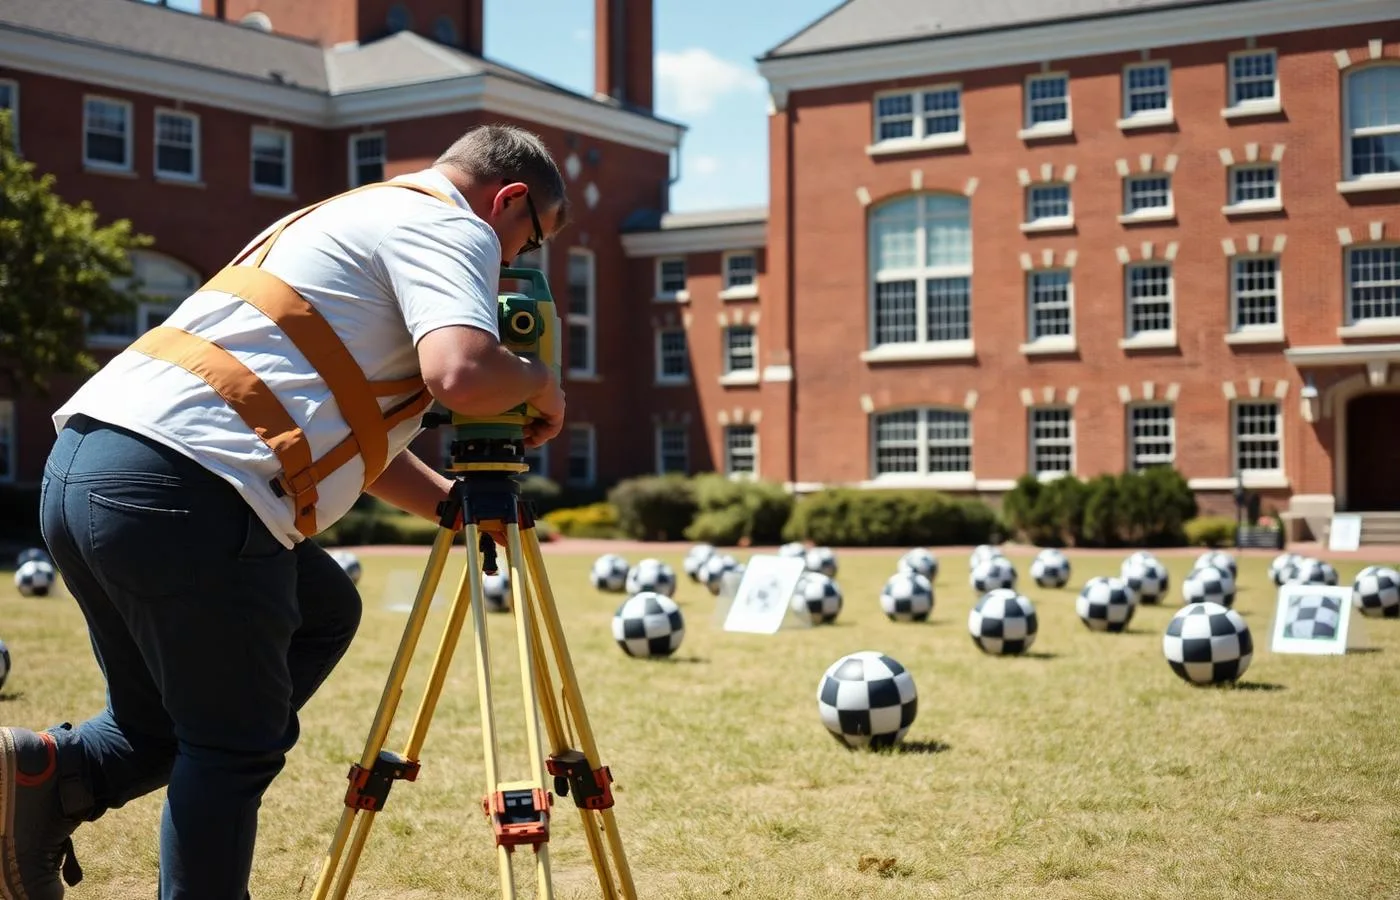
- Checkerboard and AprilTag targets at building entries and long interiors, giving the SLAM solution solid “truth” anchors
Every interior and exterior scan — mobile, terrestrial, and drone — was registered to that single control. Our final campus dataset closed within ±0.02 ft (±6 mm) across the longest interior-to-exterior loops. Inside individual buildings the relative alignment was tighter: ±0.013 ft (±4 mm).
Step 2: A Hybrid Capture Plan That Fits Each Space
We don’t use one tool because no single tool is best for every space. This campus needed three capture modes plus conventional survey.
- Mobile LiDAR — NavVis VLX3 for corridors, classrooms, lobbies, stacks in the library
- Effective point spacing: 8–12 mm at 10 m
- Typical run rate: 25,000–40,000 sq ft per operator per day in connected interiors
- SLAM loop closures every 8–12 minutes to limit drift; targets at transitions and long runs
- Terrestrial tripod — Leica RTC360 in the chapel, rotunda, mechanical rooms, narrow stairs
- Better for detailed heritage and MEP: 3–5 mm at 10 m with HDR imagery
- 40–60 stations/day depending on occlusions
- UAS photogrammetry — drone flights for roofs, courtyards, and overall massing
- 0.7–1.2 in/pixel GSD; RTK tagging to the site control
- GPS RTK rover — hardscape, walks, curb ramps, and utility surface features (valves, cleanouts)
- ADA-critical elevations at 25–30 ft spacing on primary paths of travel
Field time totaled 9 calendar days with a 3-person crew split into two interior teams and one exterior team. The only time we waited was for the pipe organ rehearsal to end in the chapel — worth it for the quiet detail.
Which tool where? Our decision matrix
| Capture method | Typical use on this campus | Accuracy target | Daily production | Notes |
|---|---|---|---|---|
| NavVis VLX3 (mobile) | Corridors, classrooms, library stacks, offices | ±0.02 ft campus-wide | 25–40k sq ft/operator | SLAM with control targets and frequent loop closures |
| Leica RTC360 (tripod) | Chapel/rotunda, mechanical rooms, tight stairs | ±0.01–0.015 ft | 40–60 stations | High-detail geometry and HDR color |
| UAS photogrammetry | Roofs, courtyards, massing context | 0.7–1.2 in/pixel | Entire campus in 2 sorties | RTK to control; infill with terrestrial where occluded |
| RTK rover | Walks, ramps, valves, manholes | 0.03 ft | 300–500 shots | ADA grades and utility surface features |
If you want the deep dive on why we pair walking scans with fixed tripod data, see our post on why mobile LiDAR beats traditional surveying for large buildings and the equipment details in Inside the NavVis VLX3: How Mobile LiDAR Captures Buildings at Walking Pace.
Step 3: Production Rhythm — Nine Days, No Do-Overs
Access windows ruled the schedule. The library, athletics tutoring center, and a science lecture hall had to be captured overnight. Custodial unlocked roofs at 6:00 a.m. only. We built the daily plan around those constraints.
Anecdote worth sharing: in the 1890s humanities hall, the north corridor looked straight by eye but was bowed about 1.1 inches over 80 feet thanks to a century of subsidence. The point cloud made it obvious; tape measures and chalk lines in a crowded hallway would have missed it. That informed the master plan’s ADA route selection the same week.
Our crew used a few rules that keep campus work smooth:
- Stage targets at every building entry in the morning; collect them at sunset
- Capture stairs twice (up and down) in mobile runs for better SLAM consistency
- Close loops through large lobbies even if it means a 90-second detour
- Log any space we couldn’t enter, then return with a spot-lock escort later that day
The result: no reshoots. No lost days to access.
From Raw Scans to a Campus Dataset
Back in the office we processed in parallel:
- Mobile runs processed through NavVis processing with loop closures tightened to control targets
- RTC360 stations registered in Cyclone REGISTER 360 (target and C2C), then tied to the total station control
- Photogrammetry solved in Metashape Pro with RTK constraints and ground control checks
- Final assembly in Autodesk ReCap for a consolidated RCP, plus E57 exports per building for downstream use in Revit and Civil 3D
Numbers most teams ask about:
- Total raw data: ~2.6 TB across all devices
- Federated RCP of campus (buildings + site): 320 GB
- Per-building E57s: 8–22 GB each (level-of-detail consistent at 8–12 mm @ 10 m for interiors)
- Site-only LAS for civil/landscape: 24 GB
- Registered accuracy: ±0.02 ft (±6 mm) campus-wide; tighter inside single structures as noted
If you’re still deciding on file formats, we unpack pros and cons here: Point Cloud File Formats Explained: E57, RCP, LAS, and PTS.
Federated Modeling: One Campus, Many Files, Zero Headaches
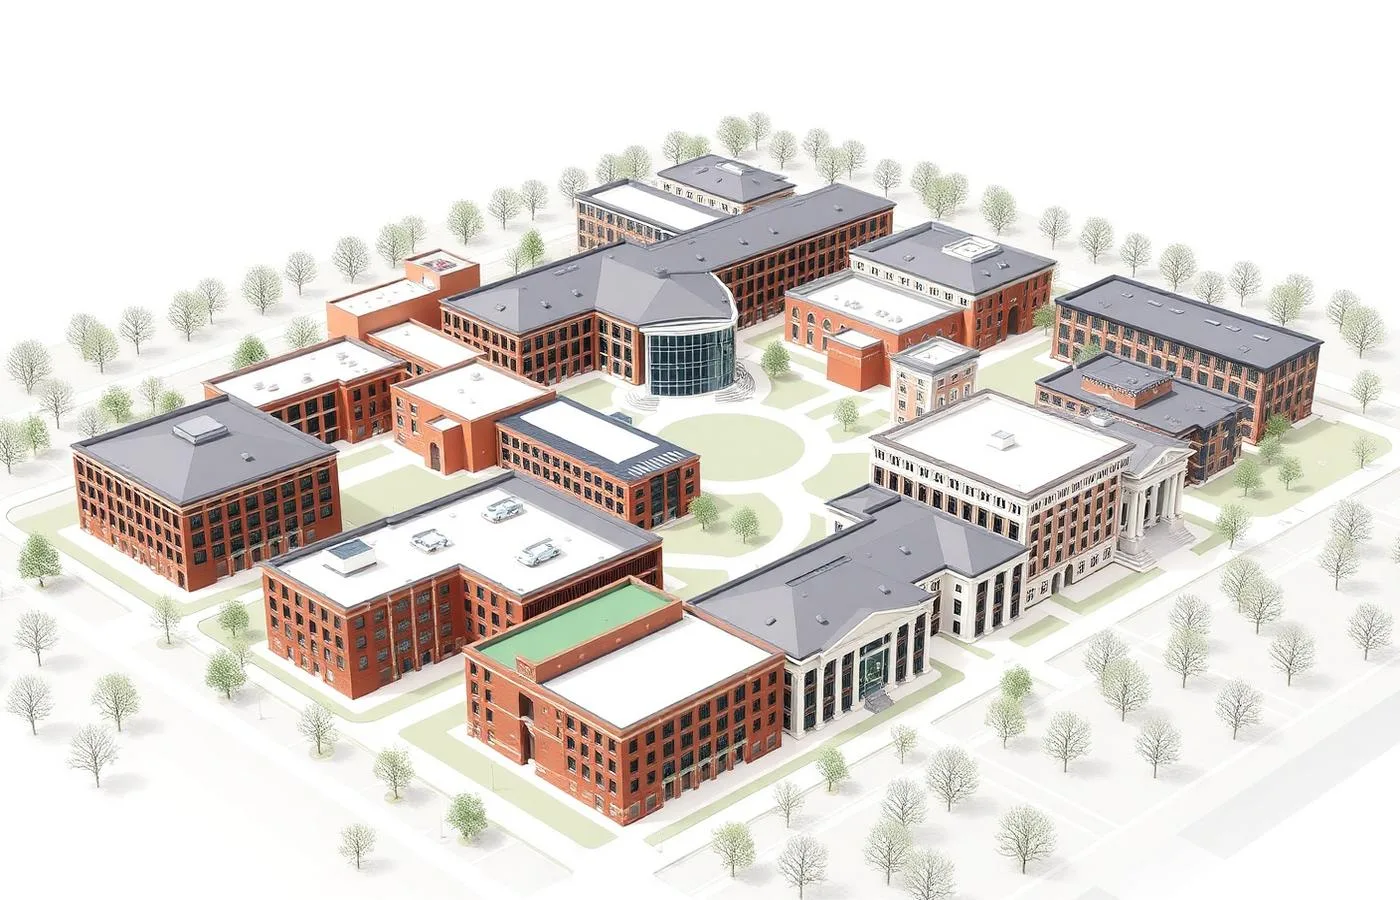
Twelve separate Revit models rarely play nicely together if they float on different coordinate islands. We built a federated system:
- One shared site coordinate origin tied to control
- One site model (Civil 3D + Revit) that holds topography, hardscape, major trees, and utility surface features
- One Revit model per building at LOD 200: core/shell, roofs, floors, major openings, primary structure; major MEP rooms blocked
- Links set up so Facilities can open the whole campus or just the building they’re touching
This matters because:
- A renovation in one hall doesn’t force a heavy republish of the entire campus
- File sizes stay manageable (most building RVTs landed between 120–220 MB)
- Utilities, site work, and ADA routing live in the site file with full context
- The model maps directly to our Scan to BIM standards and LOD guidance; if you need a refresher on what LOD 200 vs 300 vs 400 means in practice, we’ve laid it out here: LOD 200 vs LOD 300 vs LOD 400
Deliverables and Turnaround
- Registered campus RCP (single file) and per-building E57 packages
- Revit LOD 200 model per building; site model with topography and hardscape
- 2D floor plans for every building and level as PDFs and DWGs (door swings, room tags, stairs, egress paths) — aligned to our Scan to CAD and Floor Plans standards
- 3D exterior mesh (OBJ) for quick master planning visuals
- Access to a hosted viewer for stakeholders who don’t work in Revit
Schedule:
- Preliminary point clouds delivered 10 days after field finish (for early planning meetings)
- First three building models in 3 weeks; remaining nine over the following 3 weeks
- Entire campus package wrapped in 8 weeks
What did the university do with the data?
Facilities and the planning consultant put the data to work immediately:
- ADA analysis across all paths of travel; we flagged 19 curb ramps above 8.33% slope and 11 path segments over 5% that now have options in the site model
- Solar/shadow studies for two proposed buildings; tree canopy modeled close enough to inform panel placement
- Early coordination for a geothermal loop; our site model mapped valve vaults and existing utilities from surface evidence, avoiding 6 exploratory digs
- Historic preservation prep for three 1890s halls; the point cloud supported measured drawings, photo documentation, and material condition notes. Scanning supported the process; it didn’t replace field observation, archival photos, or mortar analysis. For more on that approach, see How 3D Scanning Supports Historic Preservation Documentation and our work in Preservation.
Quantified impact over the first semester:
- 12 fewer RFIs tied to dimension conflicts on an accessibility package
- $85,000 avoided in repeated field verification trips and ad‑hoc surveys (architect, civil, and MEP teams combined)
- An internal “campus changes” task list moved from sticky notes to tracked deltas inside the federated model
“We’ve never had every building, every walk, every tree tied together like this. When we talk about moving a bus stop 30 feet, everyone can see the grades, the doors, and the utilities on one screen.” — Associate Director of Facilities Planning
Preservation Note: Tools Don’t Replace Practice
Three of the older halls are on a National Register path. We modeled geometry and captured high‑density detail in the chapel and rotunda with the RTC360, but the preservation team still led with measured drawings, condition assessments, and materials documentation. The scans supported — not replaced — their work by giving reliable dimensions and context. If you’re planning adaptive reuse, our notes here may help: Scan to BIM for Adaptive Reuse: Turning Historic Buildings into Apartments and the broader Adaptive Reuse perspective.
Lessons We’d Share With Any Campus Team
- Establish control before you scan. A half‑day with a total station saves weeks of CAD heroics later.
- Write your deliverable spec. Define LOD, file naming, coordinate system, levels, and what’s modeled vs. referenced. Start with our template: How to Write a 3D Scan Deliverable Spec That Protects Your Project.
- Schedule by access windows, not buildings. Your crew should mirror operations: libraries and student centers overnight; roofs at opening; labs when escorted.
- Don’t chase millimeters where you don’t need them. The VLX3 gave us 8–12 mm spacing at 10 m for corridors and classrooms; we used tripod data only where 2–3 mm detail mattered.
- Loop early, loop often. The best SLAM is still better with tight, frequent closures anchored to control.
- Plan for data size. Expect a federated RCP in the hundreds of GB. Get IT involved early for storage and sync.
For teams budgeting or evaluating providers, our checklist and case stories can help: Choosing the Right 3D Scanning Provider: A Buyer’s Checklist, the Downtown Mansfield: 180K Sq Ft in 3 Weeks case, and how estimators use point clouds in precon: Preconstruction Estimating with Point Cloud Data.
Why did this work in nine days?
- Right tool for the right space — mobile for coverage, tripod for detail, drone for roofs
- Control everywhere — targets, traverse, and GNSS pinned the whole campus together
- Parallel crews and night access
- Tight processing pipeline: Cyclone, NavVis processing, ReCap, then federated Revit with LOD matched to scope
Could we have scanned each building as a one‑off? Sure. But the master plan would have paid the price for years. This way, any architect, engineer, or facilities planner opens a single, measured context whenever they start a task. That’s the point.
If your campus is in Mansfield, Columbus, Cleveland, or Cincinnati, we know the access and weather patterns well enough to get it right the first time. We’ve pushed the VLX3 through a February snow squall on the Oval and still closed loops under ±0.02 ft thanks to targets and good control.
The Package You Receive
- One federated campus point cloud (RCP) and per‑building E57 exports
- Per‑building Revit models at LOD 200, plus a site model for grades and hardscape
- 2D drawings aligned to your title block and sheet standards
- A clear folder structure, coordinate metadata, and a readme that explains how to link everything
- Optional hosted viewer for non‑Revit stakeholders
All of it ties back to the same ground truth. The next project on campus already has its as‑builts.
Looking for similar support? Explore our Scan to BIM process, the tools on our Technology page, or browse the Portfolio.