TL;DR
Six connected historic buildings — 180,000 sq ft — captured in 6 field days at ±6 mm and delivered as a Revit 2024 LOD 300 model in three weeks. The web viewer replaced 14 planned site visits (about $18,000 in travel), and the measured baseline backed the developer's tax credit and grant submissions.
Mansfield’s Downtown, Captured and Modeled in Three Weeks
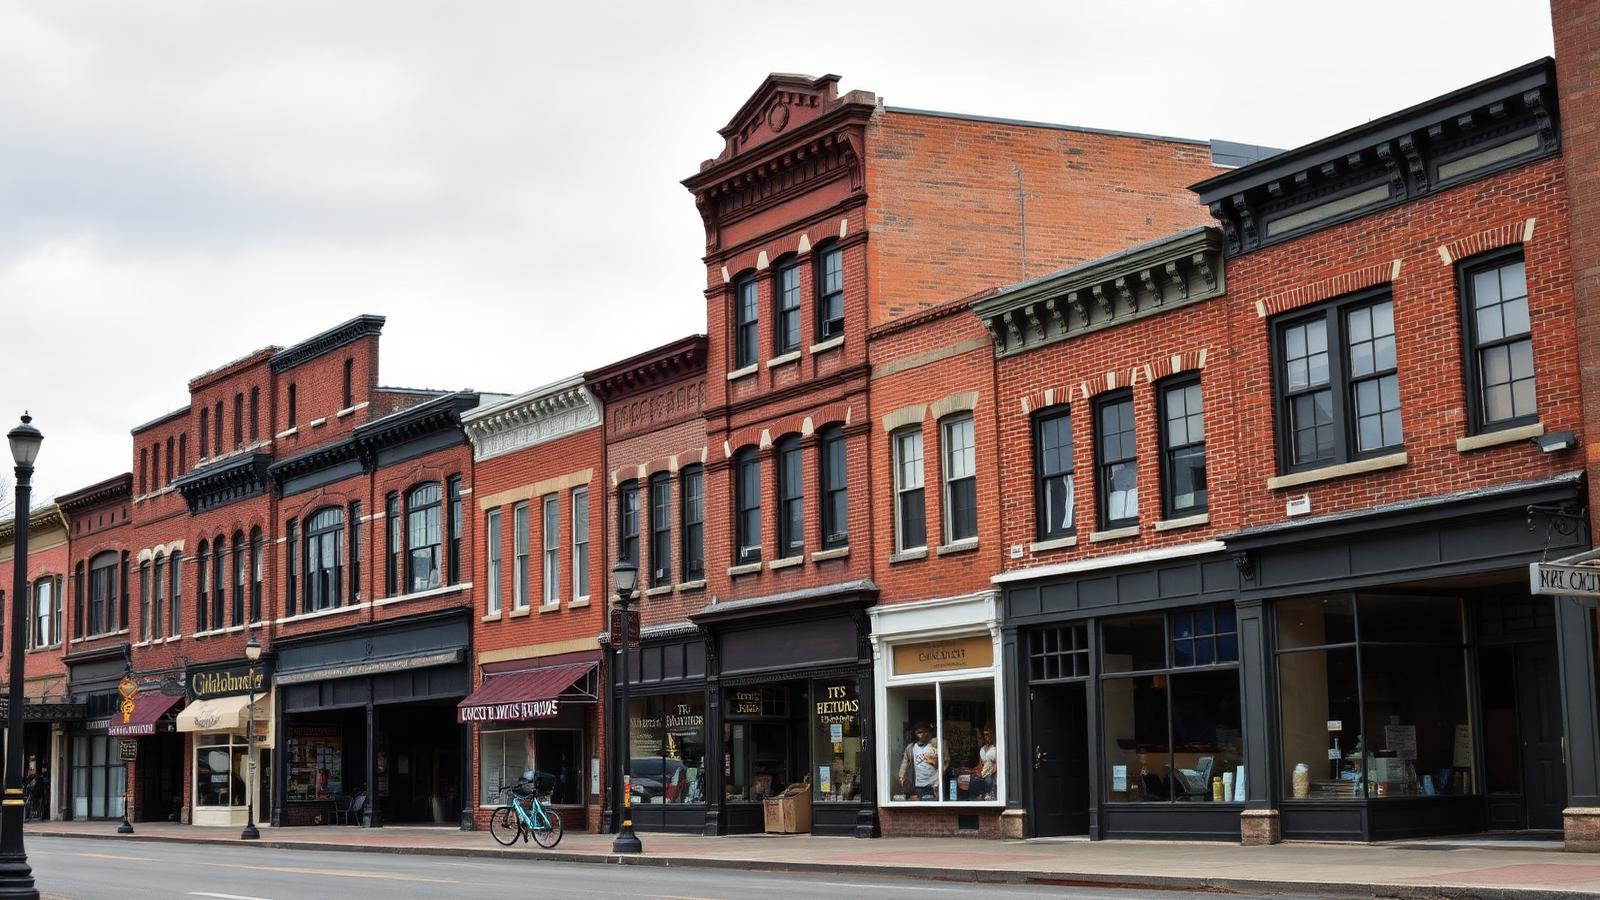
A block of connected historic buildings in downtown Mansfield—180,000 square feet of mixed retail, former offices, and long-vacant upper floors—needed to move from guesswork to measured reality. The developer’s goals were clear: support adaptive reuse design, substantiate preservation grants and tax credit applications, and give the architects real geometry instead of stitched-together anecdotes. ZEALOT Reality Capture handled the scanning and modeling. From first tripod to final Revit models took 21 calendar days.
This is how we did it, down to the nuts and bolts.
Scope at a Glance
- 180,000 sq ft across multiple interconnected historic structures
- 6 field days: interior and facade capture
- 2,000+ colorized panoramic images linked to the point cloud
- Registered accuracy: ±6 mm across floors and between buildings
- Point density: 5–10 mm at 10 m interior range
- Deliverables in 3 weeks: Revit 2024 LOD 300 architectural model + LOD 200 visible MEP/structure, E57 and RCP/RCS point clouds, panoramic viewer
- Total data volume: ~210 GB E57, ~68 GB RCP, ~75 GB imagery
What made it hard?
- Floor-to-floor changes and uneven structural grids after a century of alterations
- Plaster over brick walls that wander by an inch or two every 30 feet
- Mixed ceiling conditions: tin tiles, lay-in grid, and exposed joists—often in the same corridor
- No trustworthy drawings; prior “as-builts” were two remodels behind reality
- Tight downtown logistics around Main Street, shared walls, and intermittent tenant access
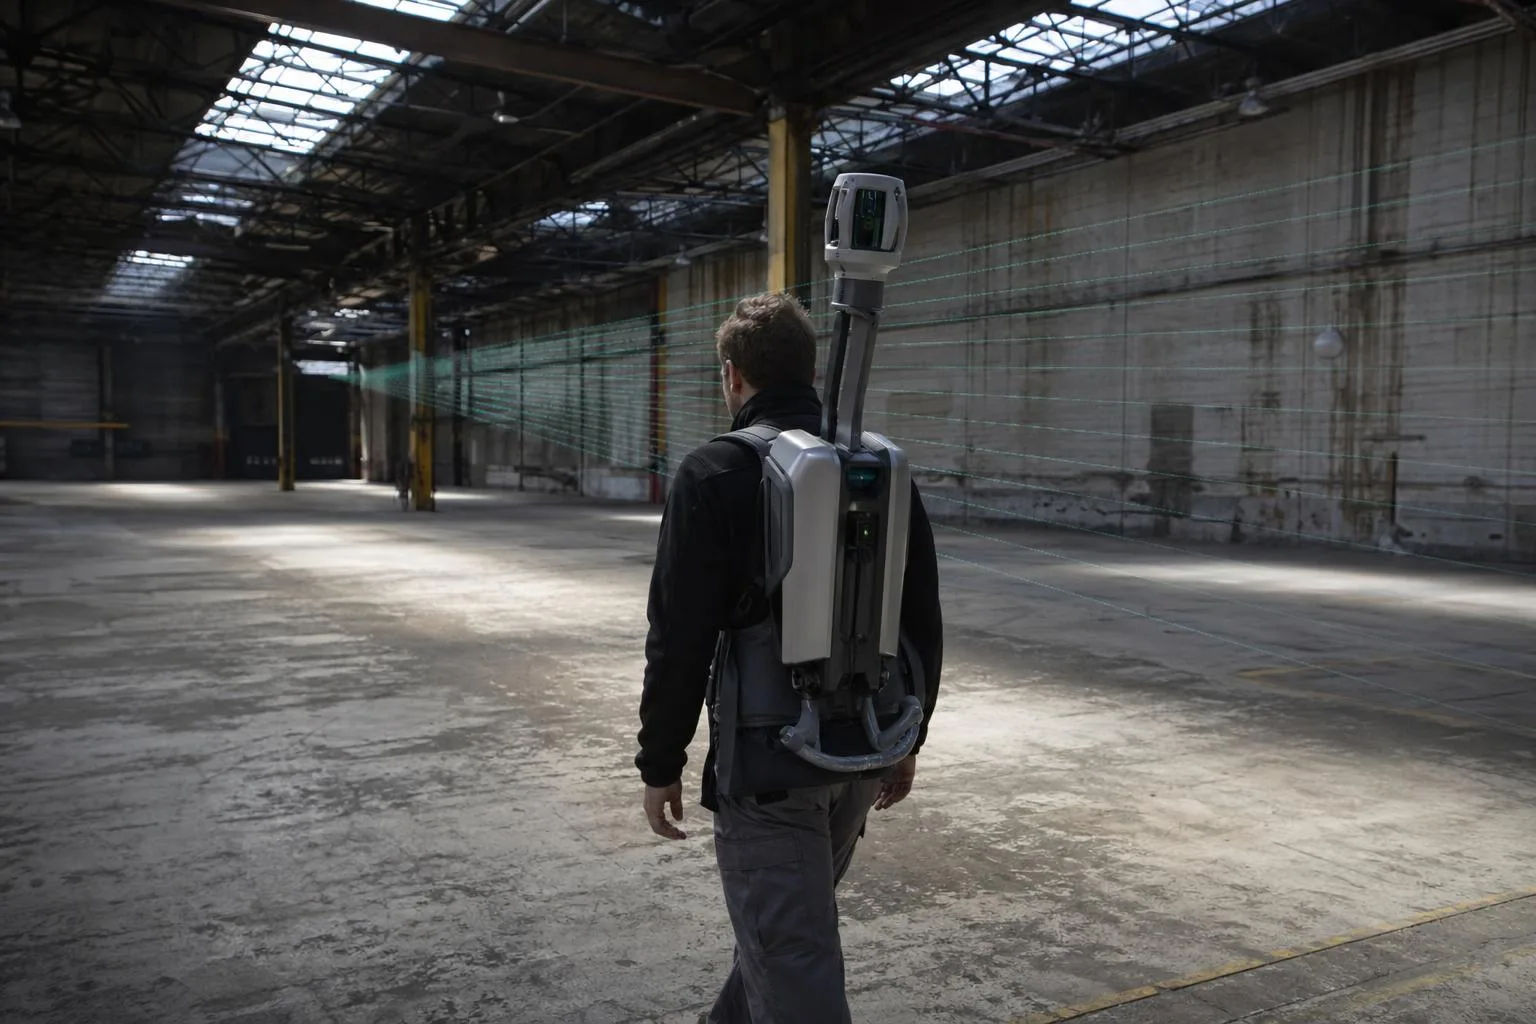
A quick field note: day two, the back stair in the north building jammed at the mid-landing—layers of paint had fused the door to the frame. We backtracked, looped the NavVis VLX3 through the adjacent suite, and closed the SLAM loop on the other side of the stairwell to keep drift to a minimum. Ten minutes lost. Zero geometry lost.
Field Capture Workflow: Walking Pace, With Control
We paired mobile LiDAR with selective terrestrial scans to keep both speed and accuracy tight:
- Primary capture: NavVis VLX3 (dual LiDAR, SLAM). Typical pace: 18,000–22,000 sq ft per operator per day.
- Supplemental setups: Leica RTC360 on facades, deep stair cores, and two light-starved basements where SLAM confidence dips.
- Control: 29 surveyed checkerboard targets tied to Ohio State Plane North, NAD83(2011), US foot. We traversed with a total station and used loop closures on each level.
- Registration: Target-constrained SLAM + cloud-to-cloud in NavVis processing; RTC360 scans registered separately, then merged. Final QA in Autodesk ReCap Pro and CloudCompare.
We scheduled around tenants and traffic. First-floor retail captured 6–9 a.m. before doors opened. Upper floors ran mid-day, with trip hazards marked in chalk and flagged in our safety briefings.
Capture Metrics
- 2,000+ panoramas at ~16 MP equivalent, every 2–3 meters
- 5–10 mm point spacing at typical interior ranges (best-fit at 5 mm in key corridors)
- 6 total field days across two weeks (weather windows favored exterior capture on days 1 and 6)
- 1.5 days of registration and QA before modeling kicked off
From Points to Models: A Clean Handoff
We keep the pipeline lean to get models in your hands fast:
- Processing: NavVis Desktop for SLAM and image stitching; export to E57 with color.
- Indexing: Autodesk ReCap Pro to generate RCP/RCS for Revit/AutoCAD workflows.
- QC: Floor-by-floor section cuts at 10 m intervals; statistical checks at control targets showed a mean residual of 4.1 mm and max of 9.7 mm.
Deliverables were built for immediate use:
- Point clouds: E57 (210 GB total across buildings) + RCP/RCS packages (68 GB)
- Panoramic viewer: hosted web viewer with scan positions linked to imagery and cloud
- CAD-ready extracts for two storefronts where quick Scan to CAD elevations were needed during schematic design
- Full model: Revit 2024, linked by building with shared coordinates
Modeling Strategy: What We Modeled—and What We Didn’t
Prescriptive modeling levels save time and reduce surprises. We agreed up front:
- Architecture: LOD 300—walls by type and thickness, windows/doors with parametric families, stair geometry, shafts, casework where fixed, ceiling grids where present, floor slopes where observed in the cloud
- Structure (visible): LOD 200—columns, beams, bearing walls, major lintels where exposed
- MEP (visible only): LOD 200—ducts >8", major pipe mains, panel locations, roof units
- Datum: Shared coordinates, level set with elevation verified at two control points per stair core
We staffed three modelers and one QA lead:
- 9 modeling days: 3 modelers x ~50 hours each
- 2 QA days: dimension checks against the cloud every 30 ft gridline and at 15 random spot checks per floor
- Clash lookahead: A quick interference pass flagged nine “tight fit” areas where proposed unit layouts would conflict with existing columns or chases
Preservation: Scanning Supports the Story, It Doesn’t Replace It
For the tax credit team, we combined the scan with traditional documentation:
- Manual condition notes (paint failure, spalling, window sash condition)
- High-res detail photos of cornices, pilasters, and pressed tin ceilings
- Archival references from the Richland County Historical Society
The 3D data underpinned measured drawings, but the narrative—historic character, contributing features—came from boots-on-the-ground observations. Scanning is a support tool here, not the whole show. See how this balance plays out in How 3D Scanning Supports Historic Preservation Documentation.
Why was mobile LiDAR the right call?
Speed matters when grant deadlines and design schedules stack up. For large interiors like this, mobile LiDAR outperforms static-only methods without giving up accuracy where it counts. We still used RTC360 where SLAM confidence dips. The hybrid approach kept drift down and doors open.
Read more background in Why Mobile LiDAR Beats Traditional Surveying for Large Buildings.
Project-Specific Comparison
| Task/Constraint | Static-Only (Terrestrial) | Hybrid Mobile LiDAR (Used Here) |
|---|---|---|
| Field time for 180k sq ft | 20–30 days, 1–2 operators | 6 days, 2 operators |
| Typical interior spacing | 3–6 mm at stations, sparse between | 5–10 mm continuous coverage |
| Registered accuracy (multi-floor) | ±3–5 mm | ±6 mm (with control) |
| Panoramic documentation | Limited per setup | 2,000+ panos, continuous |
| Turnaround to Revit | 6–10 weeks | 3 weeks |
| Estimated travel/field cost | 1.8–2.4x | Baseline |
Which results mattered?
- Three-week turnaround. Weeks, not months. Scan, register, model, QA—done.
- Remote verification. The web viewer replaced 14 planned site visits by the architect and MEP team—about $18,000 in travel and time saved.
- Fewer unknowns. Eleven RFIs were avoided in schematic/DD phase thanks to early visibility of misaligned shafts, uneven bearing walls, and a duct chase concealed above a tiled soffit.
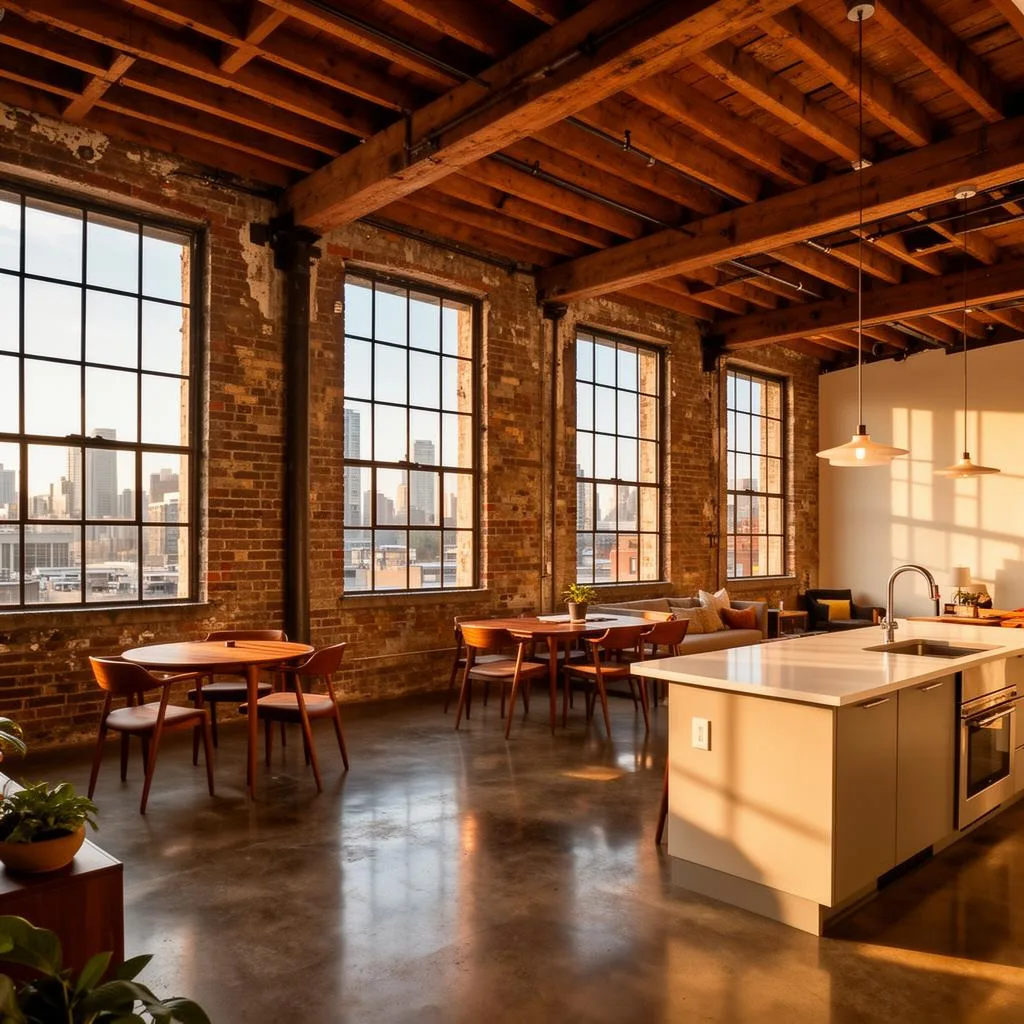
- Better unit planning. The Revit model became the base for test fits and renderings, essential for lender packages and community meetings. For similar work, see Scan to BIM for Adaptive Reuse: Turning Historic Buildings into Apartments.
- Grant and HTC support. The imagery and measured geometry strengthened the state tax credit application packet. Reviewers could see, not imagine, existing conditions.
“When we debated moving two kitchens to clear a shear wall, the cloud and panoramas made the decision immediate. No more guessing. We reworked the plan in an hour instead of burning a week on site walks.” — Project Architect, Mansfield
A Few Field Lessons for Downtown Blocks
- Loop closures are king. Always end where you started on each level. It keeps SLAM drift tight and QA simple.
- Use control in every building, not just the first. Shared party walls often aren’t plumb; independent control catches the truth.
- Plan exteriors around light. We scanned facades early morning and late afternoon to minimize harsh reflections off storefront glass.
- Mark hazards and move on. We flagged open floor registers with pink tape and scanned past them; no reason to overthink what the point cloud already shows.
If you’re tackling a similar block in Columbus, Cleveland, or Cincinnati, set expectations up front. Don’t model hidden MEP unless it’s exposed or you’re cutting ceilings. Define LOD by system. And agree on file formats—E57 for interoperability, RCP/RCS for immediate Autodesk use. We outline these choices in our Scan to BIM scopes and our guide on How to Write a 3D Scan Deliverable Spec That Protects Your Project.
Deliverables Recap
- Point clouds: E57 (colored), RCP/RCS packaged by building and floor
- Revit model: 2024, LOD 300 Arch / LOD 200 visible Structure + MEP, shared coordinates
- Panoramas: 2,000+ positions linked to geometry, browser-based viewer
- Drawings on request: Floor plan extractions for the first permit set via As-Built Documentation and 2D/3D Floor Plans
For more examples of scale and speed, take a look at our portfolio and the campus-wide capture story in Capturing a 12-Building University Campus in 9 Days.
Bottom Line
Choosing a hybrid approach—mobile LiDAR for coverage, terrestrial for tough corners—let us deliver a reliable Revit baseline in three weeks for 180,000 square feet of intertwined, historic fabric. The data supports design, budgeting, and preservation without endless field visits. It’s a practical way to move downtown revitalization from ambition to construction documents.
Ready to Move Your Block Forward?
ZEALOT Reality Capture handles occupied buildings, tight schedules, and complex geometry. We scan at walking pace, lock it down with control, and hand you models that hold up through DD and CD. Learn more about our Building 3D Laser Scanning, Scan to BIM services, and the tools we use on every job in our technology stack.