TL;DR
We captured 220,000 sq ft of live process plant in 5 field days with zero downtime, pairing VLX3 mobile capture with 38 RTC360 setups at tie-ins to hold ±6 mm. The LOD 300 model exposed 143 pipe runs routed differently than the PDFs claimed and retired 26 potential RFIs — roughly $340,000 in avoided rework.
A central-Ohio food processor called us with a tight ask: document real conditions across two connected buildings — 220,000 sq ft of conveyors, vessels, and pipe racks — while lines stayed live. The engineer of record didn’t mince words. Their PDFs were 18 years old. Modeling from them would be guesswork, and guesses get expensive. We had 21 days before design kickoff. We finished field capture in five.
“If production can’t stop, your scanning plan has to fit around it — not the other way around.”

The site and the stakes
It had all the usual retrofit landmines — and a few extras:
- 220,000 sq ft across two buildings with multiple elevations and tie-ins
- Live production flanking retrofit areas; shutdowns not permitted
- A dense ceiling forest: process piping, cable tray, and HVAC 14–28 ft up
- Mezzanines, narrow catwalks, and tight chases with limited access
- A hard clock: 21 days until mechanical layout had to start
Tripod-only would have meant 3+ weeks onsite and lane closures during shift changes. Not happening. We needed the speed of mobile capture with the precision of static scans where it mattered.
If you’re weighing options for a similar facility, see how we typically scope Building 3D Laser Scanning for industrial projects and why mobile-first wins on footprint in this post.
Why did hybrid capture beat tripod-only?
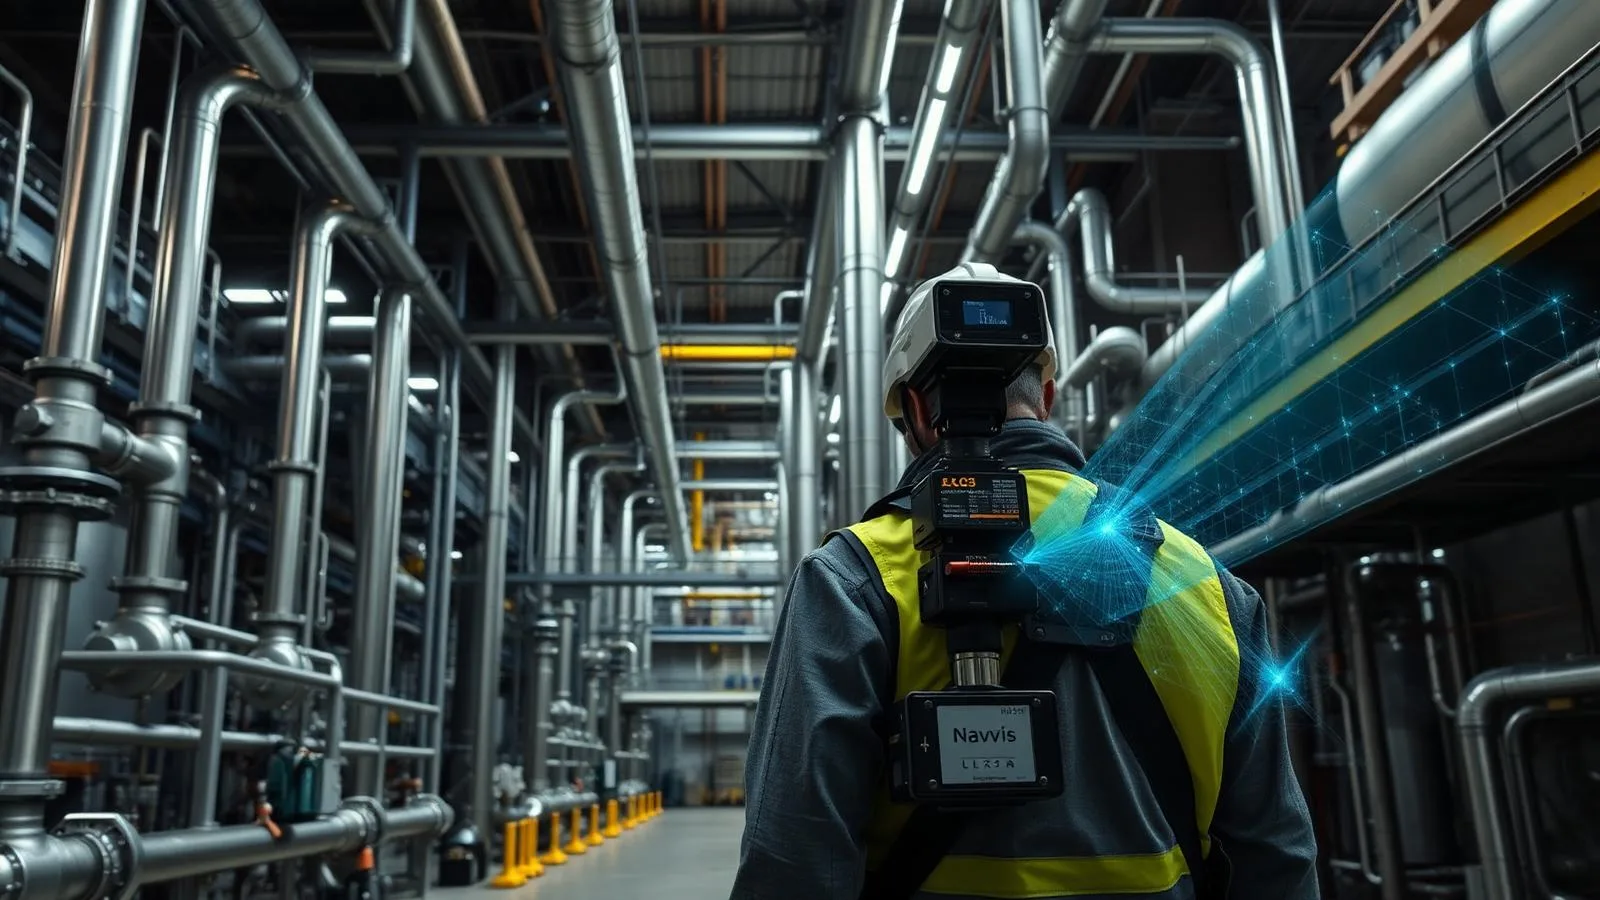
We paired the NavVis VLX3 with targeted static work. The VLX3’s SLAM engine handles long corridors, open floors, and mezzanines at walking pace. Static stations (Leica RTC360) lock in geometry at tie-in points, pump bases, and equipment interfaces where ±6 mm matters.
| Approach | Field days (220k sq ft) | Plant downtime | Typical point spacing | Registration accuracy | Notes |
|---|---|---|---|---|---|
| Tripod-only (RTC360/Faro Focus) | 15–20 | Moderate to high | 3–6 mm | ±3–5 mm | Excellent for tie-ins but slow in catwalks/long runs |
| Mobile-only (VLX3) | 3–4 | None | 5–10 mm @ 10 m | ±10–15 mm (control-aligned) | Fast, but tie-ins need more certainty |
| Hybrid (VLX3 + RTC360) | 5 | None | 5–10 mm general, 3–6 mm at tie-ins | ±6 mm registered to control | The sweet spot for retrofit coordination |
We’ve written about the VLX3’s speed under load here: Inside the NavVis VLX3.
Field execution: five days, zero downtime
We staged out of a maintenance alcove between lines to keep clear of traffic. Second shift gave us the best run time between forklift bursts and sanitation cycles. Hard hats, hearing protection, and a radio on ops’ channel. Simple setup; tight choreography.
Day 0.5 — Pre-walk and control
- Coordinated with plant safety for hot/cold zones and egress.
- Set 34 checkerboard targets and four 145 mm spheres per building wing.
- Tied into the facility grid and vertical datum with total station control shots at each fire-rated separation.
- Walked the route plan to identify loop closures for SLAM and dead-end chases that would require static.
Days 1–3 — Mobile capture at walking pace
- NavVis VLX3 runs averaged 60,000–70,000 sq ft/day.
- Point density targeted 6–8 mm in production zones; slightly denser on mezzanines where clearance is tight.
- Closed loops around major corridors to keep SLAM drift under control; re-traversed two segments during a vibration-heavy batch cycle when a bank of motors spooled up.
- Exterior tie-ins captured for dock doors and utility penetrations to help the site plan in CAD.
Day 4 — Static reinforcement at critical interfaces
- 38 RTC360 stations at tie-ins, pump skids, and valve clusters.
- 2:00–3:00 minute per station with HDR imagery for context.
- Focused on new-to-old connections, flange faces, nozzle orientations, and housekeeping pads.
- Spheres and checkerboards bridged SLAM-to-static; cloud-to-cloud to targets in Leica Cyclone REGISTER 360.
Nightly — Registration QA
- NavVis SLAM processing and IVION review each evening; visual QC on loop closures and colorization.
- Merged RTC360 and VLX3 clouds via E57 exchange; unified registration to plant control.
- Daily checks on target residuals; accepted only when residuals sat within ±4–6 mm.
Total field time: five days. No lane closures. No impact to throughput.
From raw scans to design-ready data
The team didn’t just want a point cloud. They needed something mechanical could detail against without babysitting dimensions in the field.
What we delivered, three weeks after the last scan:
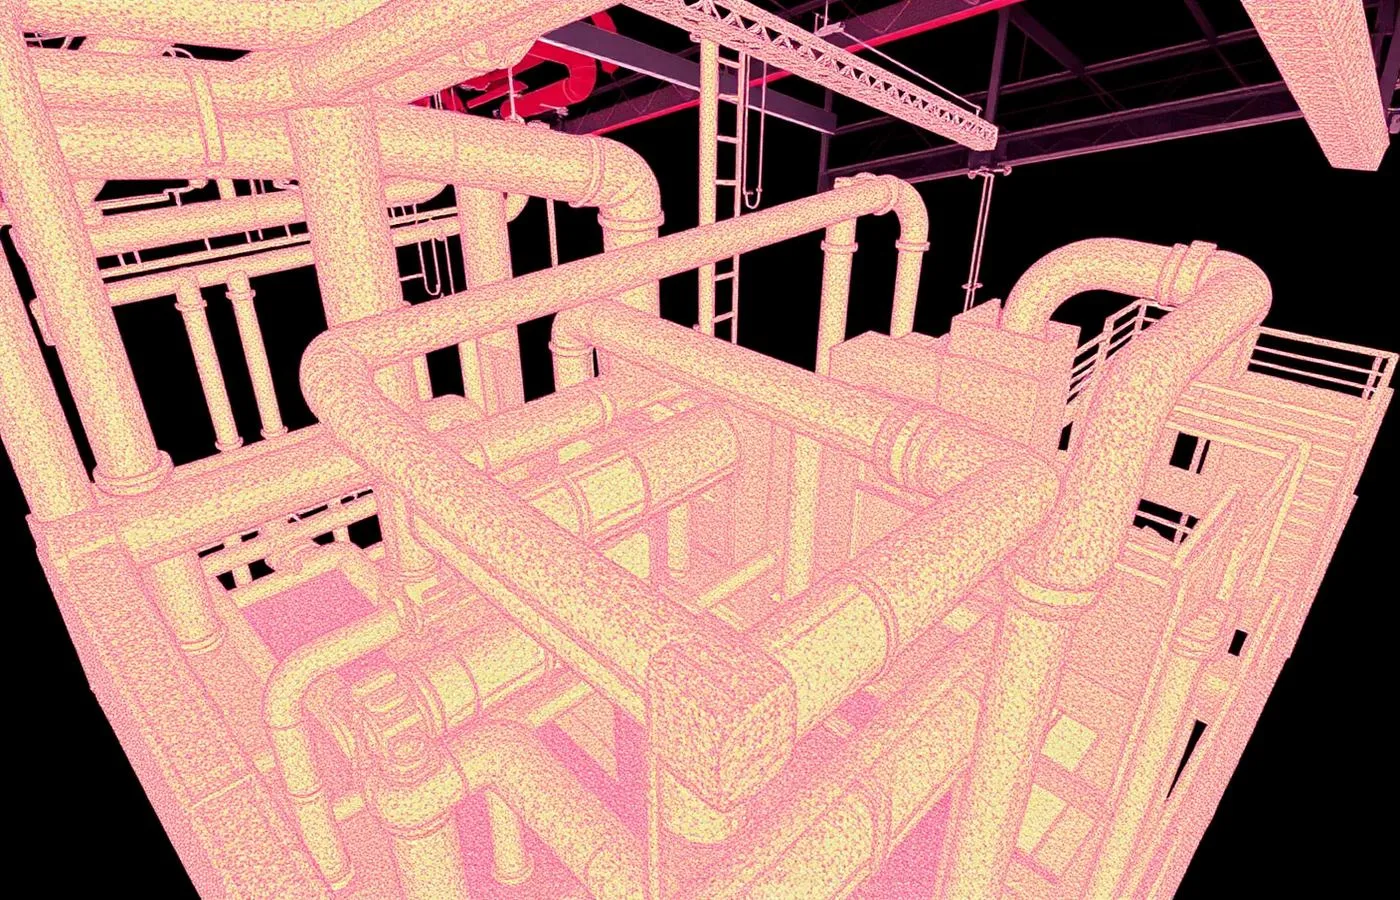
- Registered, colorized point cloud in RCP/RCS for Autodesk Recap, plus archival E57 and LAS. Aggregated size: 185 GB RCP set; 420 GB raw; sectioned deliverables by area to keep file handling sane.
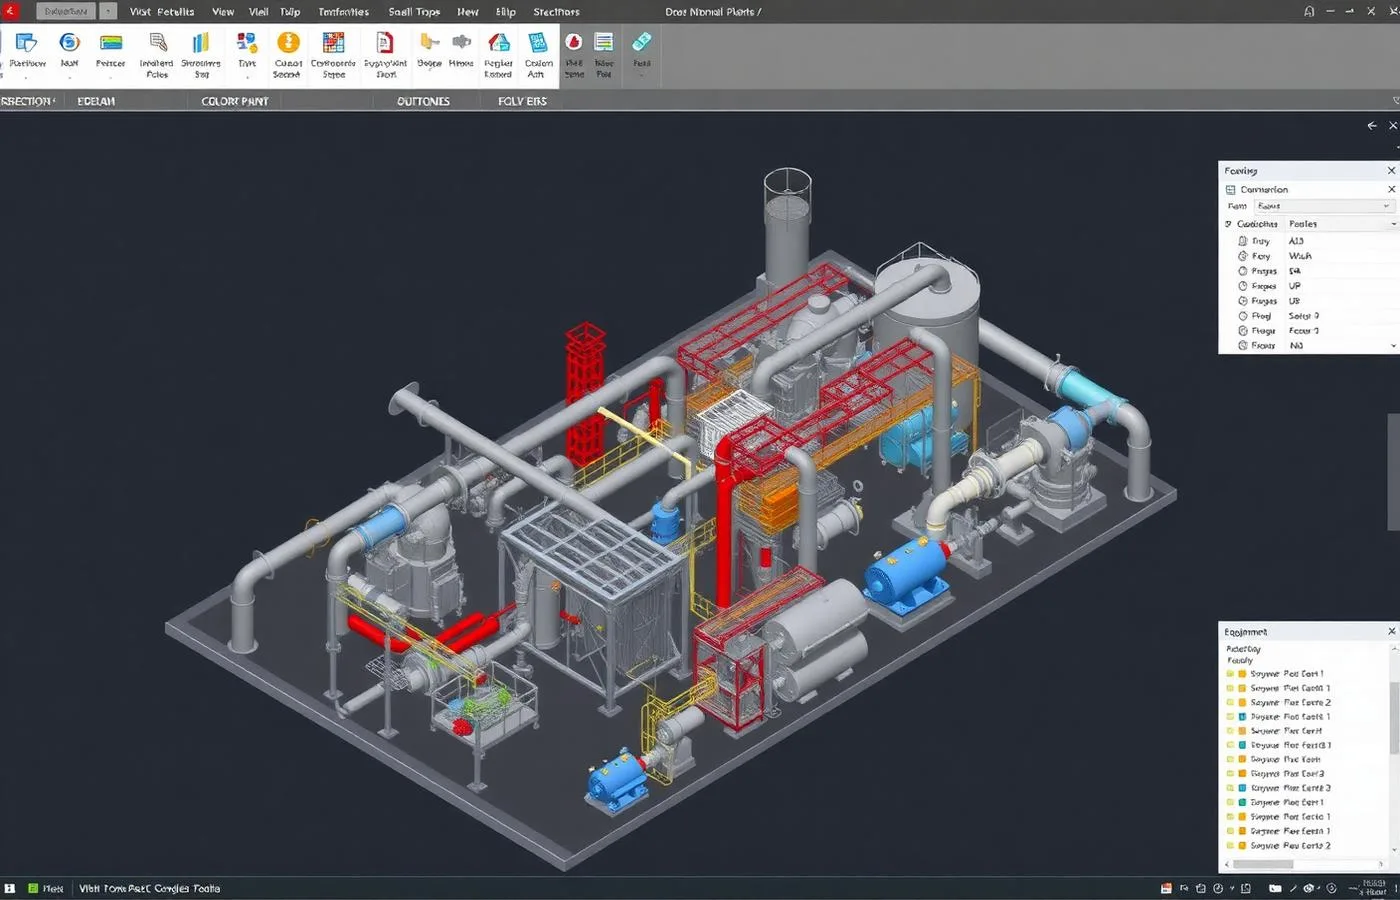
- An LOD 300 Revit model of structure, architectural shells, primary MEP, and all pipe 2" and larger, classified by system (process, steam, condensate, utility water) with system colors.
- 2D floor plans and sections at each mezzanine elevation as DWGs for the detailing team — a quick win for those not living in Revit. If you’re after similar outputs, this is our standard Scan to CAD and 2D/3D Floor Plans workflow.
- Datum alignment to the plant grid and survey benchmark so layout could be pushed back to the floor later without translation errors.
- A structured clash review comparing the model to the legacy PDFs, flagged by severity with screenshots and station markers.
- A short spec sheet for how to consume the cloud/model, matching our published guidance here: How to write a 3D scan deliverable spec.
For teams new to file types and indexing: this explainer is handy — Point cloud file formats: E57, RCP, LAS, PTS. And for BIM scope options, see Scan to BIM (LOD 200/300/400).
What did the model expose before demo day?
Once the Revit model landed, coordination started immediately. Within a week, we had answers to questions that would have turned into RFIs on site.
- 143 pipe runs were routed differently than the PDFs suggested — not small offsets, but reroutes around equipment added during a 2008 expansion.
- Two entire utility chases had been relocated; the old plans still showed them flanking a stair that no longer existed.
- Floor elevations in the older wing were off by an average of 1.2 inches; across 110 ft of conveyor, that’s enough to bind bearings.
- 26 potential RFIs were retired early — mostly about flange orientations and clearance to new cable tray.
- Estimated rework and change orders avoided: roughly $340,000. The schedule held at 11 months.
We also fed quantities from the point cloud into estimating to sanity-check hangers and demo takeoffs, a workflow we outline here: Preconstruction estimating with point cloud data.
Practical notes from the floor
These are the little things that keep a five-day plan on the rails in a live plant:
- Work around sanitation. We paused capture during high-mist washdowns to avoid point cloud “snow.”
- Plan your loop closures. In the west wing, a simple extra pass around a pipe gallery knocked 9 mm of SLAM drift down to 3 mm.
- Use second-shift quiet windows. We grabbed mezzanine catwalks between forklift peaks; one pass, no rescans.
- Keep ops in the loop. A two-minute radio call saved us an hour when a valve changeover rerouted steam and fogged an entire bay.
If you’re planning similar, our short guide for owners is a useful handout: How to prepare your site for a 3D laser scan.
Where does this fit in your retrofit playbook?
Scanning didn’t replace engineering. It made engineering honest. The model and point cloud became the ground truth everyone pointed to: mechanical, electrical, controls, and the GC. For this client, design coordination stayed in Revit against the LOD 300 model; field teams used clipped RCPs on iPads for quick checks. As-builts at turnover will be added to the same dataset to close the loop — standard practice on our As-Built Documentation projects.
Three takeaways we’ve learned, project after project:
- Don’t assume the PDFs — or last year’s markup — reflect what’s overhead.
- Hybrid capture gets you speed and certainty. Use mobile for coverage and static where bolts and flanges matter.
- Tie everything to control. If layout matters later, it matters now.
If you want to see more examples like this one, our portfolio includes a live-process retrofit in Cleveland and a 250,000 sq ft distribution center scanned in four days.
Key takeaway
Cheap drawings are expensive mid-project. The scan was the smallest line item on this retrofit and the one that protected the other 95% of the budget.
For teams in construction, engineering, or architecture tackling similar conditions, get the scope right up front — LOD targets, point spacing, file formats, and control — and you’ll keep design moving without midnight field trips.